There are two kinds of people in the PC gaming world: those who use test using FurMark and those who say, “Fur… what?” If you tell the latter that FurMark is a program that “creates a giant furry doughnut”, they might end the conversation right there. I would stick with the description that FurMark is the most aggressive graphics benchmarking tool available. Not only can it provide information on framerate and temperature, it will also give you a comparison score or even push your card to 100% for stability testing. Best of all, it is a free tool. Just be sure to read the warnings and perhaps watch a youtube video or two about FurMark testing gone bad.
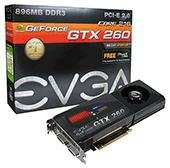
The GTX260 55nm version does really well under the stress tests of FurMark, as the smaller fabrication method results in more manageable temperatures. I never got to a point during testing where I began to worry about anything. As stated on page 4, the temperature during Xtreme Burning Mode never went beyond 68°C. Always set the fan to 100% when performing these tests. The following tests are the averages of 10 benchmarks of the standard 60 seconds.
|
FurMark Settings
|
FurMark Benchmarks: 60 seconds
|
Solid Tip: Don’t use Furmark scores to compare one card to another. Only use it to compare scores from the same card. See why in this article.


