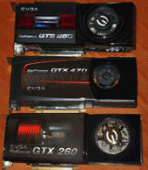
SolidlyStated recently completed its 3 part series of Solid Reviews for EVGA Nvidia cards, spanning entry-level to high-end gaming. Each article is packed with info. In this summary, we will pit all 3 cards head-to-head and aggregate the results for them at both stock and overclocked speeds.
You can check out those previous articles below. They are each 8 pages packed full of everything. They contain all the EVGA model numbers for the 3 chipsets, overclocking details, temperatures reached, Furmark scores, Far Cry 2 benchmarks, Crysis benchmarks, card features, and more. Lets not waste any time.
*My original % gains were incorrect and have been updated as of Aug 2010*
EVGA Nvidia Solid Reviews
| Article | Model | Fab. Size | Cores | Length |
|---|---|---|---|---|
| GTS 250 | 512-P3-1150-TR | 65nm | 128 | 9.5″ |
| GTX 260 | 012-P3-1470-AR | 55nm | 216 | 10.5″ |
| GTX 470 | 012-P3-1470-AR | 40nm | 448 | 9.5″ |
Clock Speeds
Speeds are listed in MHz, of course. The overclocked (OC) speeds were the highest achieveable on stock cooling without having any crashes or graphical artifacts.
| Card | Core | Memory | Shader | OC Core | OC Memory | OC Shader | Avg. Gain |
|---|---|---|---|---|---|---|---|
| GTS 250 | 756 | 2200 | 1836 | 825 | 2454 | 2025 | 10.3% |
| GTX 260 | 576 | 1998 | 1242 | 740 | 2660 | 1600 | 30.1% |
| GTX 470 | 608 | 1674 | 1215 | 800 | 1920 | 1600 | 26.0% |
Furmark Scores
Time: 60 seconds, Resolution: 1680 x 1050, Anti-Aliasing: 16, Windowed, Options: Post-FX
Solid Tip:Note that Furmark scores can vary greatly depending on the drivers used.
| Card | Stock Furmarks | OverClocked Furmarks | Gain |
|---|---|---|---|
| GTS 250 driver 196.21 | 2045 | 2246 | 9.8% |
| GTX 260 driver 196.21 | 2201 | 2837 | 28.9% |
| GTX 470 driver 197.55 | 4485 | 5547 | 23.7% |
Far Cry 2 Benchmark
Game Resolution: 1680 x 1050, Anti-Aliasing: 4x, Fullscreen: yes, VSync: off, Advanced Settings: Ultra High
| Card | Stock Frame Total | Overclocked Total | Gain |
|---|---|---|---|
| GTS 250 | 1982 | 2113 | 6.6% |
| GTX 260 | 2158 | 3202 | 48.3% |
| GTX 470 | 4485 | 5665 | 26.3% |
Crysis Benchmark
Game Resolution: 1680 x 1050, Anti-Aliasing: 4x, Fullscreen: yes, Advanced Settings: Very High
At these settings, the GTS 250 is not playable when combat starts.
| Card | Stock Frame Rate | OverClocked Frame Rate | Gain |
|---|---|---|---|
| GTS 250 | 13.0 | 14.3 | 10.0% |
| GTX 260 | 18.63 | 23.85 | 28.0% |
| GTX 470 | 30.0 | 37.6 | 25.3% |
Conclusions
The GTX 260 Core 216 is an overclocker’s dream. It has the highest potential for improvement and keeps cool even under 100% load. A great card that did well under every test!
The GTS 250, on the other hand, had very little hopes of playing any game on high setting or at a resolution above 1680 x 1050. That’s bad news for gamers as most new monitors jumped on the 1080P bandwagon. What makes it attractive in this market is its very low price tag. If you are happy playing on medium graphics settings, go for it. This card is also 55nm now, making it a better board than the one in our tests.
The ‘Fermi’ GTX 470, Nvidia’s DirectX 11 powerhouse, eats both of these cards alive. If you combine the GTS 250 and GTX 260 benchmark scores, the GTX 470 is still higher! Unfortunately the same equation is true if you combine the price of the GTS 250 and GTX 260. It still carries a somewhat reasonable price tag, thanks to the GTX 480.
As I state in all 3 Solid Reviews, EVGA makes a great product, provides great services (register your card!), and has a very active community.
You cannot go wrong with any of these cards. See you next time!


I was thinking buy a GTS 250 but I want to play high games and I’m not sure if the GTS is good enough. I would like to buy a GTX 260 but it’s still expensive for me! hahaha
Running a GTX480 right now. For someone in the guy above’s position, I’d pick up a GTX460. Wicked good card for roughly $200. You can’t go wrong.
Additionally, the GTS 450 was just released. This is the Fermi (DirectX 11) successor to the GTS 250 and is priced about $130 – $150. You can check them out here.