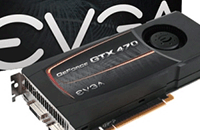
There are two kinds of people in the PC gaming world: those who use test using FurMark and those who say, “Fur… what?” If you tell the latter that FurMark is a program that “creates a giant furry doughnut”, they might end the conversation right there. I would stick with the description that FurMark is the most aggressive graphics benchmarking tool available. Not only can it provide information on framerate and temperature, it will also give you a comparison score or even push your card to 100% for stability testing. Best of all, it is a free tool. Our GTX 470 never got past 73°C during the tests, far from the 105°C limit.
The GTX 470 doubled the performance of the entry-level 250 in this labratory-type benchmark. It was also way beyond the GTX 260 Core 216. These scores, however, will always fluctuate based on the current driver you are using (because Nvidia tweaks drivers to perform better in these tests). This is why I always say that Furmark is only for comparing a single card at different speeds. Don’t attempt to compare your Furmark score with scores from other GPUs.
Again, both driver versions available produced the same Furmark score, so we wont show both sets of results.
|
FurMark Settings
|
FurMark Benchmarks: 60 seconds
|
Solid Tip: Don’t use Furmark to compare one GPU to another. It is only reliable when comparing scores from the same card. See why in this Furmark article.


